Thadeus Geodfrey is a leading voice in the financial industry. You’ll appreciate the expert ease with which he does this. He deciphers the intricate link between emotions and behavior in trading and investment. With extensive experience as a senior trading writer, Thadeus imparts his knowledge and confidence to guide your trading boat. He’ll make you conquer your fears, break barriers, and capitalize on every potential opportunity. Follow his pieces and develop your knack for trading.
We may receive compensation from our partners for placement of their products or services, which helps to maintain our site. We may also receive compensation if you click on certain links posted on our site. While compensation arrangements may affect the order, position or placement of product information, it doesn’t influence our assessment of those products.
Fundamental and technical analysis in trading are two approaches traders view the market. These methods help traders and investors research and forecast trends in the market price movements of financial security. Some traders use a combination of both, while others prefer either, but both methods have their strengths and weaknesses. Today, however, our focus is technical analysis.
What is Technical Analysis?

Technical analysis in trading assumes a security’s price reflects all the known fundamentals, and thus, the only inputs we focus on are prices and volume traded. Our concern as traders or investors is how the price will perform.
Simply put,
Technical analysis is the examination of the price of a security and its volume traded to identify trading opportunities in the spotted trends and patterns.
The core belief is that price movements don’t just happen; they exhibit identifiable patterns and trends traders can predict and exploit. So, we ignore the asset’s innate value and identify buying patterns and price trends that suggest how the security trade will be in the future.
How to Use Technical Analysis for Your Effective Trading?

Effective trading in financial markets using technical analysis is important as it works on any tradable security subject to forces of supply and demand. So, you can use it for stocks, commodities, bonds, fixed-income, currency pairs, derivatives, and other securities. It’s helpful where traders focus on short-term price movements, like in commodities and forex markets.
While day traders can make decisions based purely on price charts and similar statistics, equity analysts use a combination of fundamental and technical analysis with other research methods.
Here’s what it takes to use technical analysis effectively:
Understanding Chart Types
As a trader, understand the different types of charts used in analysis. Bar, line, and candlestick charts are useful as each provides independent insights. Candlestick charts, in particular, provide detailed information on price movements within a specific period. Mastering all these charts is primary to your success as a trader in effectively predicting price movement.
Identifying Trends
You should be in a position to predict and identify market trends. That’s the goal of technical analysis. It gives you foresight on the market’s direction. If you foresee a bullish trend and take advantage, you can profit when the asset price changes upward. Alternatively, you nip your losses in the bud if you predict a bearish market before the prices fall. You’ll also know when the market is neutral.
Using Technical Indicators
Technical analysts and traders have many trading systems, called indicators, which help forecast trends and price movements. Some indicators can signal price trends, identify chart patterns, and volume and momentum. Others identify the oscillation points, moving averages, support and resistance levels, and the likelihood of its continuation. We look at them later on.
Drawing Support and Resistance Levels
Traders need entry and exit points for their trades, and to do this, they need to identify the support and resistance levels. These are the price points where the price of an asset tends to stop and reverse the price direction.
Volume Analysis
You study the volume traded in the technical analysis. In most cases, if there’s a high volume of trade even with the price increase, chances are people have a strong buying interest. On the contrary, they could be high volume when the price is dipping. In this case, the traders are under pressure to sell.
Backtesting Strategies
As you learn technical analysis, you develop strategies, and before you subject them to the live market, you test them. Subjecting your strategy to historical data helps you measure its effectiveness.
Technical Analysis Tools
Technical analysis tools are indicators that traders and analysts use to confirm trends, identify overbought or oversold conditions, and spot potential reversals. There are several such tools pivotal in the analysis. They include:
Software like MetaTrader, TradingView, and ThinkorSwim offer advanced charting capabilities and a wide range of technical indicators.
Simple Moving Averages (SMA) and Exponential Moving Averages (EMA) help smooth out price data to identify trends.
Tools like RSI and Stochastic Oscillators help you determine overbought or oversold conditions.
On-balance volume (OBV) and Volume-Price Trend (VPT) indicators help analyse trading volume relative to price changes.
Tools and software that help in identifying chart patterns like Head and Shoulders, Double Top/Bottom, and Triangles.
Educational Resources
Technical analysis studies a financial instrument’s market price movements and trading volume. Much of this is solely determined by the demand and supply forces. So, to learn technical analysis, you need educational resources on demand and supply. Here are some options for you:
Books
Some years ago, we believed books were the source of knowledge. But today, knowledge is everywhere with us. You don’t necessarily have to get the actual book. You could get them on the Kindle store or e-books on Amazon. You can also get them as audiobooks.
You’ve lots of options if you want to discover more about technical analysis. For starters, check these two books out:
- John Murphy’s “Technical Analysis of the Financial Markets”
- “A Complete Guide to Volume Price Analysis” by Anna Coulling
Online Courses
We live in the information age when learning is not just through books and mentors. Today, you can have access to lots of comprehensive courses on anything. You can learn technical analysis on platforms like Coursera and Udemy. YouTube also has some good content on the same.
Webinars and Seminars
Some financial websites, blogs, and trading platforms host regular webinars and seminars. They bring expert traders and analysts as guest speakers to such shows. If that’s not enough, you can always look for recorded videos of such webinars on YouTube.
Trading Communities
The Internet has turned the world into a small village. You can ask anything and get like-minded people to help you. One such approach is the online forums and social media groups. Social media platforms like Facebook, X spaces, Reddit, or even Quora have trading communities that link you with experienced traders who share their insights.
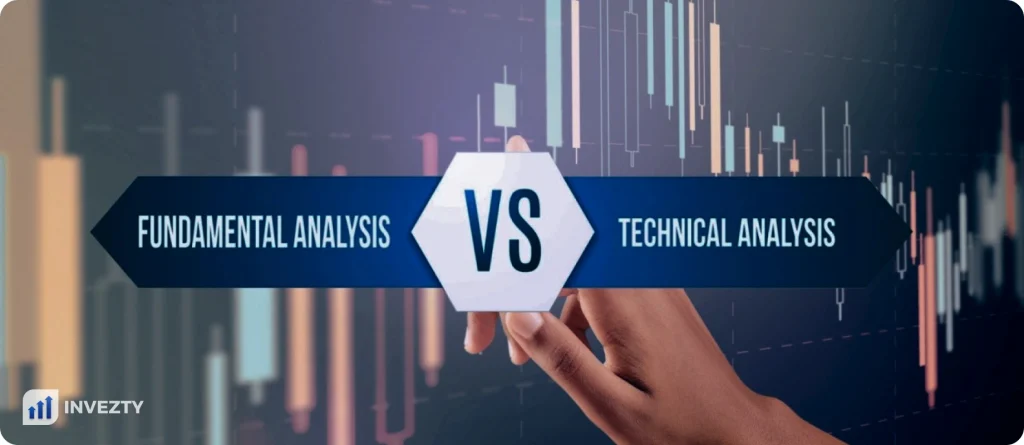
Technical Analysis vs Fundamental Analysis

As we already stated, technical analysis focuses on price patterns and market trends. Fundamental analysis, on the other hand, evaluates a financial instrument based on economic indicators and performance.
Technical and fundamental analysis differ sharply in three spheres – time, source of data, and the need they address.
Technical analysis predicts trends and an asset’s future price based on historical data and forces of demand and supply. This data is available on charts and historical price data. As such, it can only tell the near future and is perfect for timing the market, which is why it’s suitable for short-term trading.
On the other hand, doing fundamental analysis means digging deeper. It evaluates securities by predicting the true value of a security. Fundamental analysts examine the economic conditions and other principal factors related to the health of the financial instrument. They get that data from economic and industry reports and the asset’s financial reports like company statements. Thus, it is more comprehensive and suited for long-term investments.
Both methodologies have their strengths and weaknesses. Choose the one that best suits your case depending on your interests and goals. Some traders use a combination of both for an informed decision.
Common Mistakes Traders Make When Using Technical Analysis
Day traders use technical analysis in their day-to-day business. But despite its potential, some traders often make mistakes. Here are some common pitfalls you must avoid:
Mistake 1: Using too many indicators leads to analysis paralysis.
Solution: Find a balance between using indicators and common sense. Don’t get overwhelmed by conflicting signals.
Mistake 2: Turning a blind eye to the risk of the identified opportunities.
Solution: Assess the risk associated with the opportunity and always set stop-loss orders and position sizes to protect against significant losses.
Mistake 3: Jumping into trades based on short-term movements without proper analysis.
Solution: Don’t chase the market. Avoid impulsive decisions by sticking to your plan developed from your analysis.
Mistake 4: Succumbing to confirmation bias by favoring your preconceived notions.
Solution: As a trader, maintain an objective view and adapt when the market conditions change. So, regularly review and adjust your trading plan based on current market trends.
Mistake 5: Lack of patience, making frequent trades without substantial analysis to chase quick profits.
Solution: Trading is a high-risk venture that requires patience and discipline. You must properly analyze your trades, develop a plan, and adhere to it.
FAQs
Yes, professional traders and even analysts often use technical analysis. But they combine it with other research techniques.
The two primary types of technical analysis are chart (pattern) and statistical analysis. The first one involves studying price patterns and visual trends, while the second uses mathematical models and statistical techniques to forecast future price movements.
When combined with the fundamental analysis, technical analysis helps you factor in the broader market view. It improves the overall valuation of a security’s strengths or weaknesses.
Yes, you can apply technical analysis to any security with historical trading data. These securities include stocks, futures, commodities, fixed-income, currencies, and cryptocurrencies.
Conclusion
Technical analysis studies historical price data and trading volumes. It uses various technical indicators to identify potential trading opportunities. You can use technical analysis alone or combine it with fundamental analysis. But like trading, this analysis requires dedication, continuous learning, and a disciplined approach. Always check out for the common pitfalls even as you use it to spot and exploit market opportunities.
